Interested in learning how geospatial information and spatial analysis can be used for enhancing planning and decision making in health disease management?
Check out these courses and enhance your GIS and data skills.
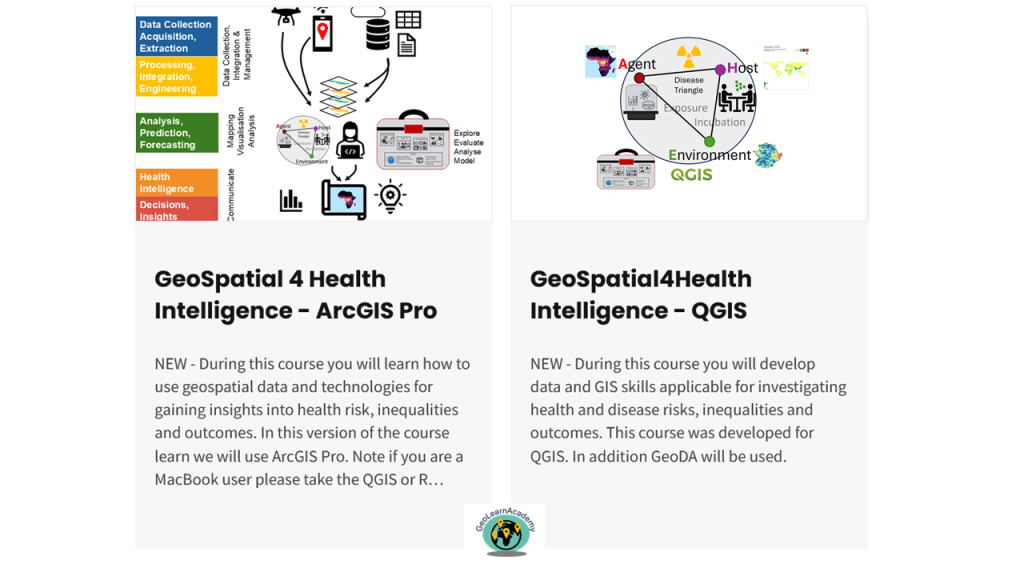
Interested in learning how geospatial information and spatial analysis can be used for enhancing planning and decision making in health disease management?
Check out these courses and enhance your GIS and data skills.
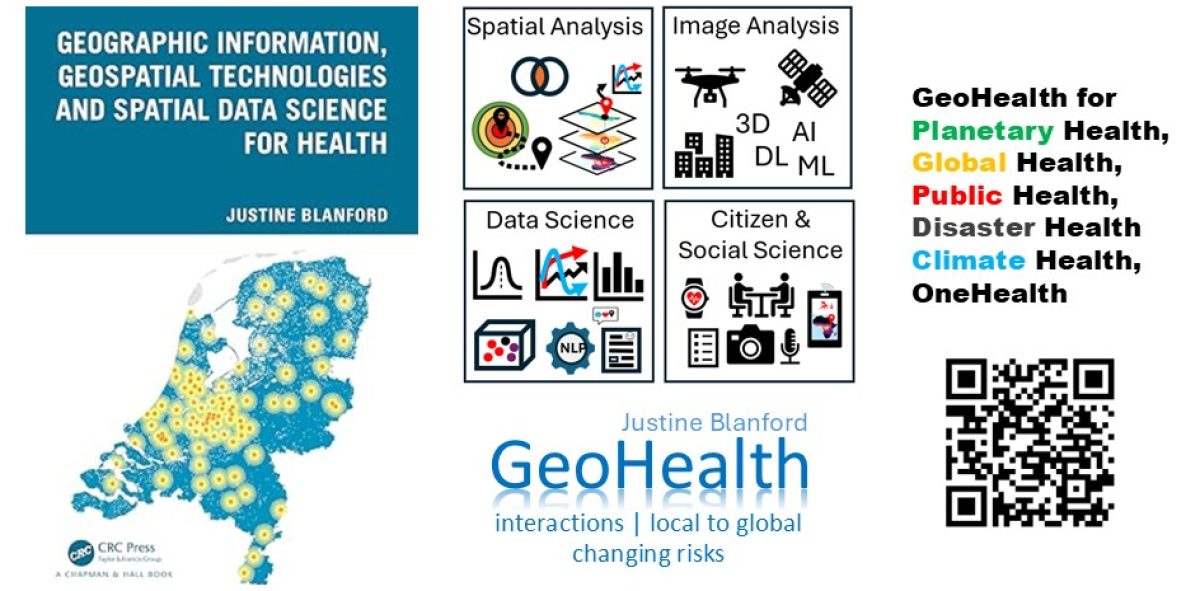
GeoHealth combines geographic information and epidemiology to understand health and disease interactions. By utilizing geospatial technologies, it visualizes disease patterns and informs public response strategies. This integrated approach considers disease ecology, healthcare accessibility, and effective communication, ultimately enhancing understanding of health risks and improving response efforts across spatial and temporal scales.
GeoSpatial4Health is the integration of geographic information, technologies and spatial concepts with epidemiology. Health and disease are complex and requires a dynamic approach to understanding the interactions driving the patterns and outcomes that we see.
Geographic Information, Geospatial technologies and GIScience play a vital role in adding context: visualizing where and when diseases occur in space and time, understanding why they may be prevalent, who may be affected and how to respond.
At GeoSpatial4Health we take an integrated geospatial approach to health intelligence where we consider the ecology of the disease (disease triangle), the response and what and how to communicate.
when we consider health and disease we need to think of three elements:
Understanding health and disease is really all about the interactions. Interactions between the (host (behaviour/lifestyle) and a pathogen (agent) in the environment where the intensity can be influenced by exposure and incubation period of the agent.
Healthr+o = ((A ∩ H ∩ E )+((HE) x V x CC))) *time
Health Risk (r) and Outcomes (o) = ((Agent – Host – Environment)+(Hazard x Exposure (HE)) x Vulnerability x (lack of ) Coping Capacity (CC)) * time
Understanding health and disease is complex. We have to think simultaneously about the interactions between an agent and a host at various spatial and temporal scales in a dynamically changing environment.
To understand these complexities at a local or global scale we need to fuse varied data sources that capture different geographies as well as be able to perform a wide variety of analyses at different spatial and temporal scales.
It is only through this integrated approach that we can understand the ecology of disease and the determinants that are driving the health risks and outcomes.
Response (Control & Prevention and Diagnosis & Treatment): (who is affected, what we do about it) how do we minimize risks? what actions do we need to take? (what healthcare and infrastructure are available and how to access) how can we access the treatment we need in a timely manner? what policies, planning and infrastructure are needed and at what scale?
Ensuring equality in access to health facilities and critical infrastructure to minimize health risks.
Visualisations and symbolisation with statistic and dynamically interactive maps and graphs. Transforming data from excel spreadsheets, outbreak reports into geo-enabled structured data that can be used to create statistic, interactive or dynamic maps.
Not only is communication about the visualisation and symbolisation but also about having the data structured and organised in a way that allows for real-time, efficient and effective information sharing.
Interested in learning more about how GIS, AI and geographic information can be used for managing health?
For more information view the website: geohealth_blanford

